

Kanshi provides a comprehensive view into your distributed system by monitoring agents and their metrics in real-time.
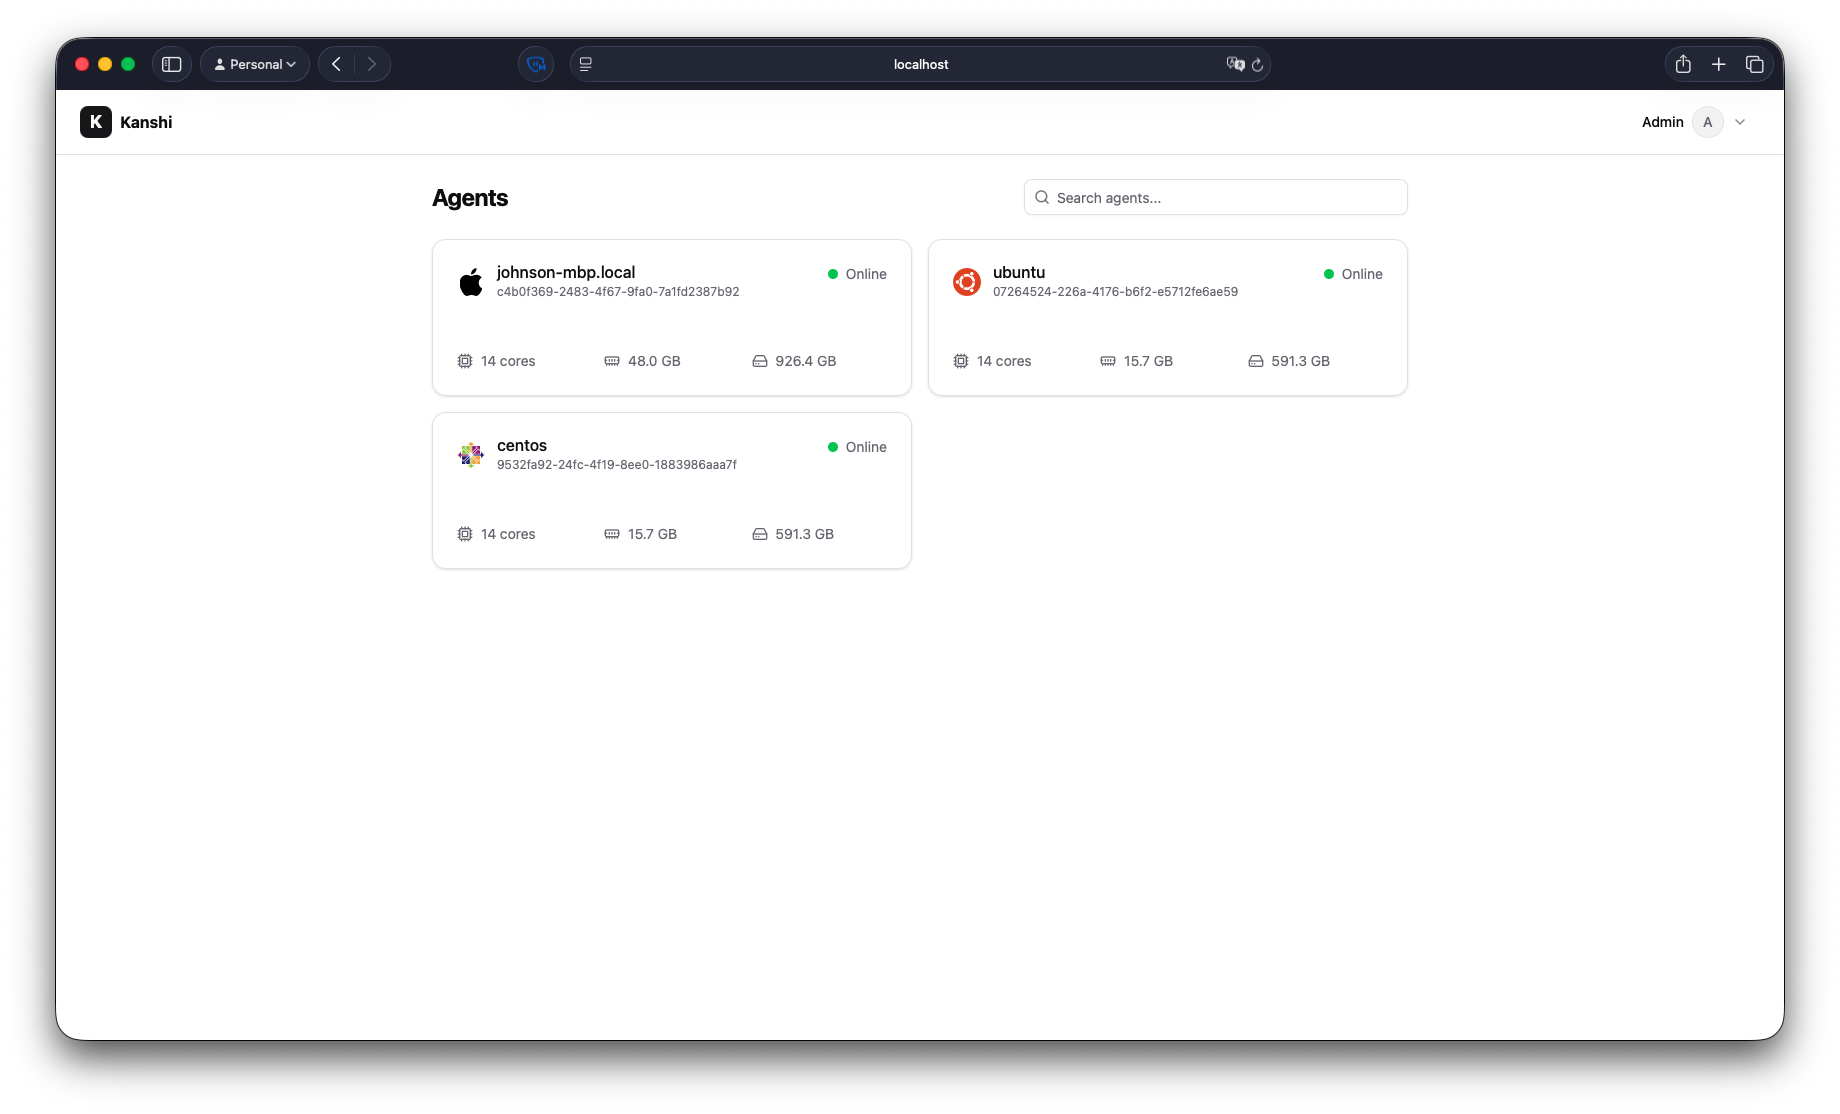
- Live Status Tracking: Instantly view the status of all active agents in your network.
- Agent Overview: Get a bird's-eye view of your entire infrastructure from a single, centralized dashboard.
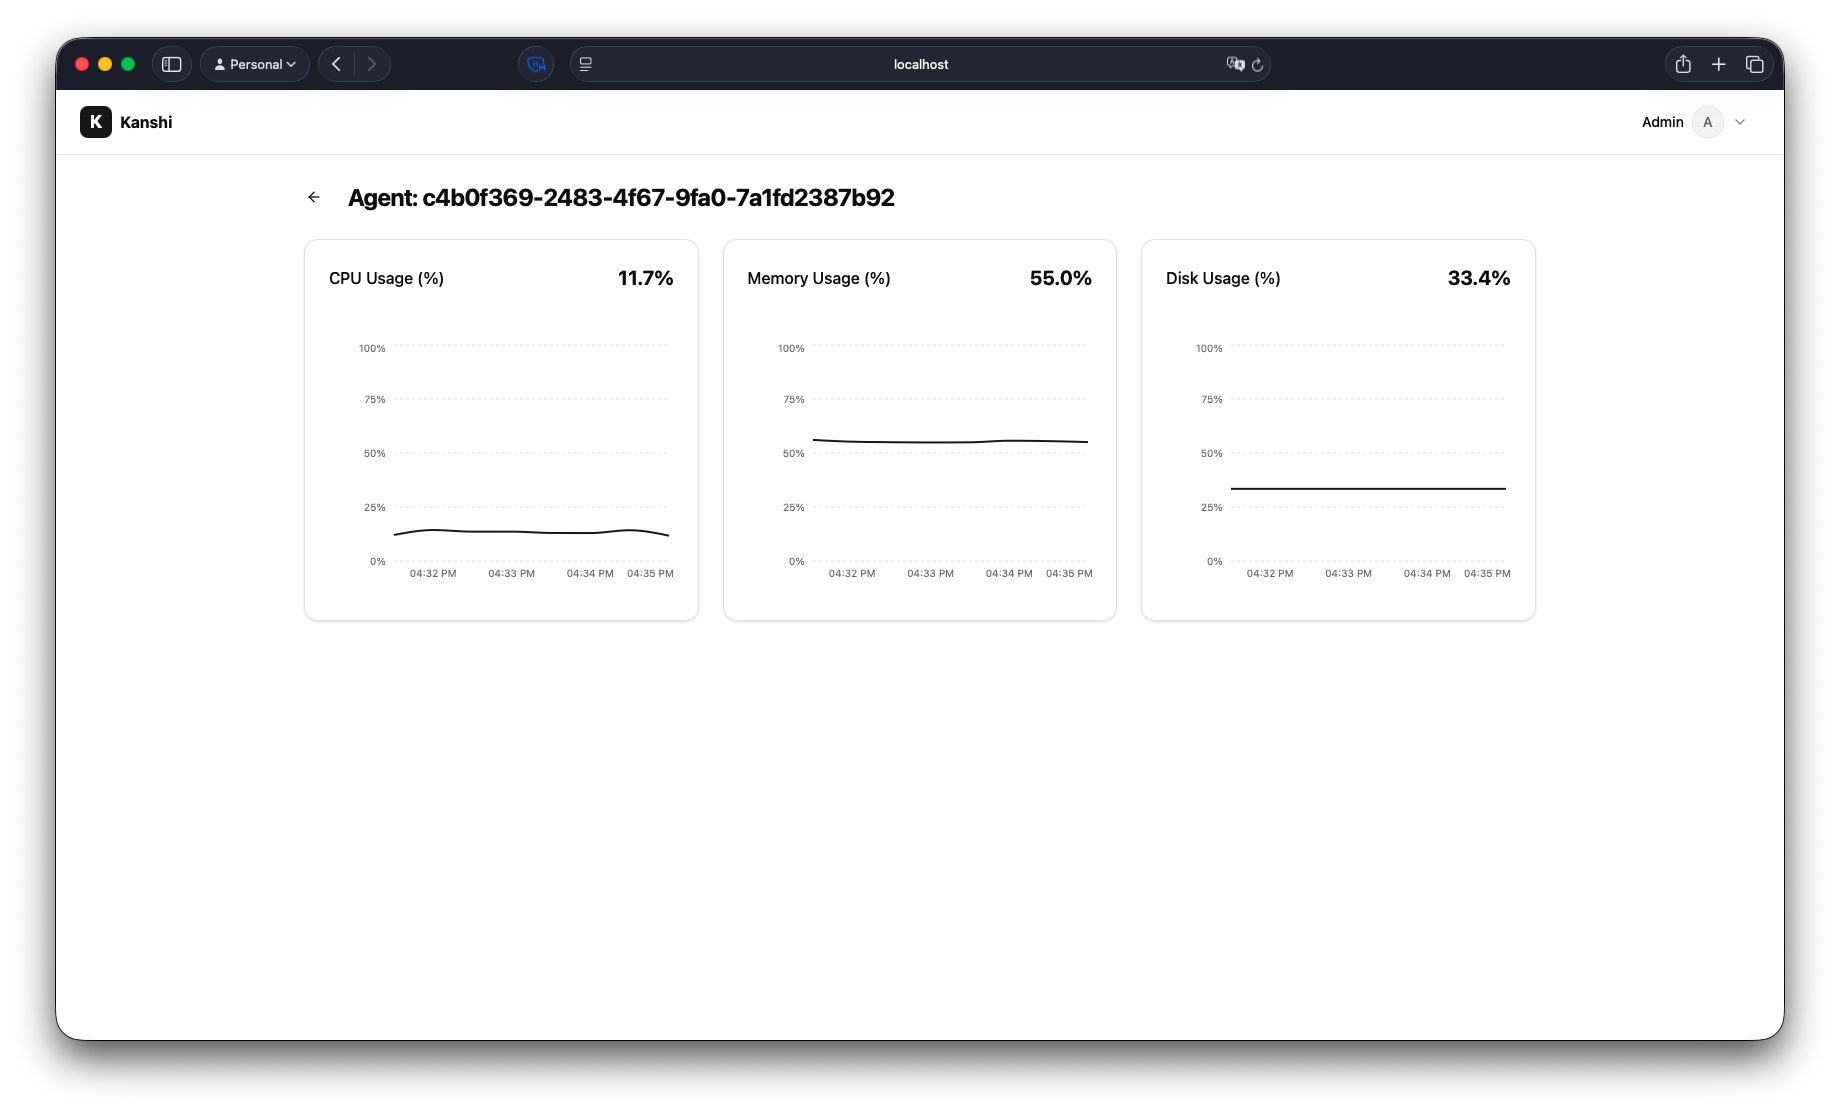
- Detailed Visualizations: Dive deep into any specific agent to see its historical and real-time performance data.
- Aggregated Metrics: View trends and patterns through interactive charts, helping you identify bottlenecks or anomalies quickly.
- Configurable Intervals: Analyze data at different time granularities to suit your monitoring needs.
- Anywhere Access: The dashboard is fully responsive, allowing you to monitor your systems from your desktop, tablet, or smartphone.
- Intuitive Navigation: Easily switch between high-level overviews and detailed agent views with a clean, user-friendly interface.
npm run dev targets http://127.0.0.1:8080/api/v1 through .env.development. Copy .env.example to .env.local only when you need to override that address. Production defaults to the same-origin /api/v1 proxy.
See the canonical quickstart to run the dashboard with the release stack.
Kanshi follows semantic versioning from v1.0.0. Bug fixes ship in v1.0.x, features wait for the next minor release, and breaking API changes wait for the next major release. Release notes are generated from merged pull requests. Use GitHub issues for public support and private vulnerability reporting for security reports. The latest v1.0.x release is supported.